Lotteries as School Funding: The Game Is Rigged
The California Lottery, like many state lotteries, presents itself as a way to generate more money for education. Lotteries, though, are a highly regressive means of raising public funding; they draw dollars disproportionately from poor neighborhoods. Compounding the problem, California distributes lottery funding without regard either for communities’ investments in the lottery or for schools’ levels of need. Like property taxes for education, which tie public school budgets to local wealth, the lottery brings economic inequality into the school system.
Skip to:
The California Lottery’s stated mission is to “maximize supplemental funding for our state’s public schools.” The lottery’s homepage, under the heading “Giving Back to the Community,” displays a picture of a little girl smiling over a stack of schoolbooks. There’s a page showing the education allocations from the lottery to every county, and how much that county has received since the lottery was established in 1985. But even though lottery money does add a little bit to the state education budget—between 1 and 2 percent annually—the lottery is an extremely poor way of raising those funds. A state lottery is one of the least efficient and most regressive means possible of raising government revenue.
In this way, sadly, it’s not unlike most state funding of public schools. America’s education systems, like all public services, are financed mainly through a variety of taxes—local property taxes, state income taxes, sales taxes, and all manner of smaller funds. Taken together, the result is far from progressive. In only a handful of states do low-income school districts get the greater funding they require to address their students’ needs. And when states introduce state lotteries as a way to improve the situation, they end up compounding rather than diminishing the inequities of school funding.
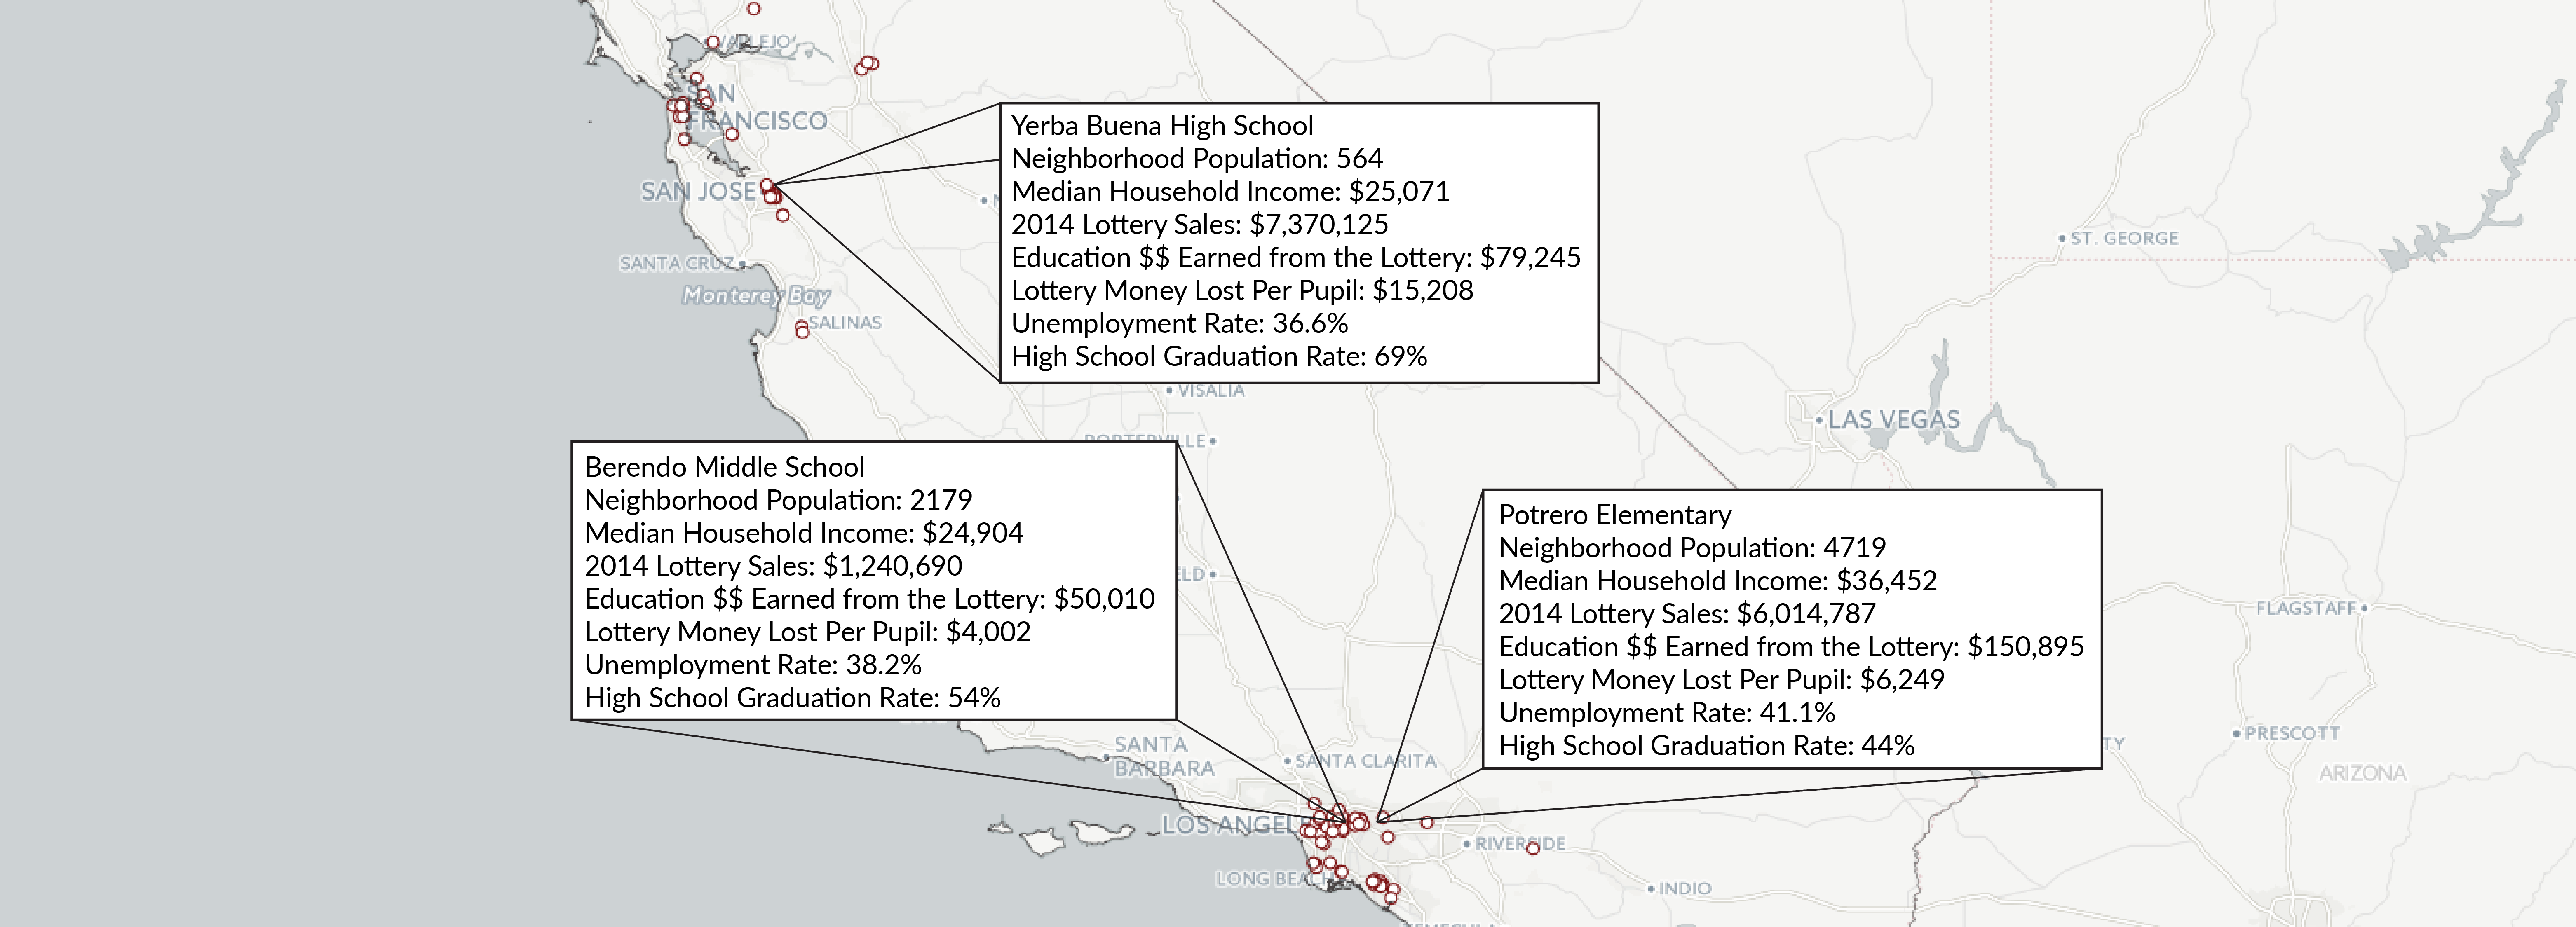
The failings of the lottery are felt most sharply in needy schools. Berendo Middle School in Los Angeles Unified School District has just over 1,000 students, 90% of them eligible for free or reduced-price lunch (FRL). Lottery retailers in the school’s immediate neighborhood sold $1.2 million in lottery tickets last year. They got back $50,000 from the California State Lottery for education—a net loss of over $4,000 per student. And there are school communities hit even harder: Potrero Elementary in San Diego County, which is 99% FRL-eligible, loses more than $6,200 per pupil. Yerba Buena High in San Jose, which is 89% FRL-eligible, loses over $15,000 per student on the lottery.
Following the Money
The lottery is one of the most regressive and inefficient means possible of raising government revenue: it draws funds disproportionately from the poor, and less than a quarter of the money raised actually goes to public schools.
Californians bought over $5 billion in lottery tickets last year as part of a government effort to raise revenue for education. Only a fraction of that money, though, ended up in California classrooms. So, where did the money come from, and where did it go?
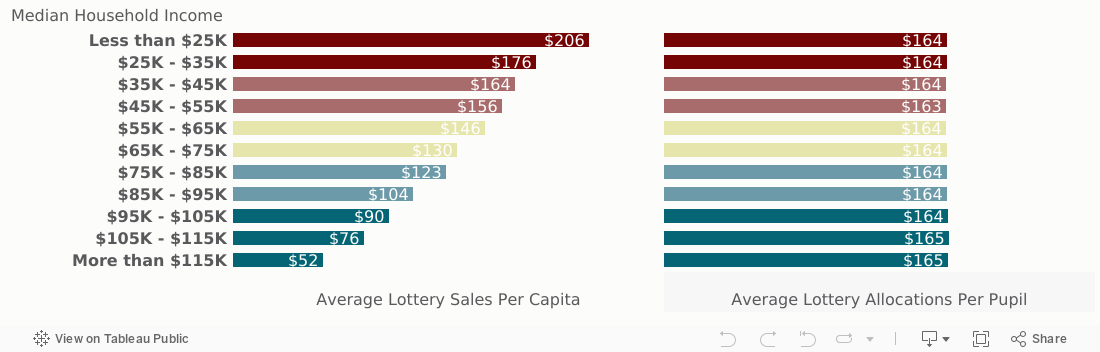
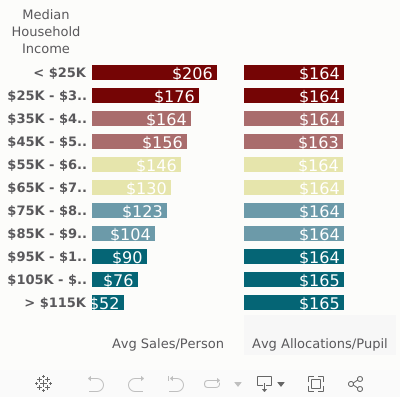
As with most lotteries, the California Lottery draws a disproportionate share of its revenue from the poor.[1] As you can see in the chart below, the state’s poorest neighborhoods spend four times as much per person on the lottery as the richest ones do. Retailers know their markets, and it’s no surprise that more stores choose to sell lottery tickets in low–income neighborhoods than in well–off areas. While the median household income in California is $61,933, homes in census tracts containing more than 10 lottery retailers earn just $43,250. The median household income of neighborhoods with no retailers, on the other hand, is more than $80,000.
Meanwhile, the state hands out the K–12 education funding produced by the games at a flat rate—in 2014, about $163 per pupil.[2] This means that disadvantaged communities get back a smaller fraction of their spending than wealthy ones, and much of the money spent on lottery tickets by low–income Californians ends up subsidizing schools in better—off neighborhoods.
Note: Allocations vary slightly because of the inclusion of charter schools, which appear to receive lottery funding at somewhat different levels than school districts do.
Now, the sales data in this figure is per capita—in communities where families bring in less than $25,000 on average, $206 is spent on the lottery annually for every man, woman, and child. When the money comes back, though, there is only $163 per student. Clearly, a lot of dollars are lost along the way.
Of an estimated $5 billion dollars in ticket sales in 2013-14, about $3.1 billion was paid out in prizes. Another $651 million went to administrative costs, leaving approximately $1.3 billion for education in the lottery budget. Based on the lottery’s reports from last year, about a fifth of that money goes to colleges and universities, leaving the rest for K-12 education. After all is said and done, public schools get less than a quarter from every dollar spent on lottery tickets.
$5.008 billion in ticket sales
- $3.085 billion in prizes
- $651.04 million in administration
- $260.41 million for higher ed
$1.088 billion for K-12 public schools
Note: dollars may not total precisely due to rounding in different information sources.
Because of how many lottery purchases are made in the lowest–income areas, a small number of people are supplying quite a lot of lottery revenue. When you rank census tracts by per–pupil loss to the lottery, the 150 tracts that lose the most provide 8.3% of lottery revenue—but they are home to just 1.5% of the state’s population. That means that these neighborhoods spend more than five times as much on lottery tickets as you’d expect, given their populations. In California, because lottery profits are allocated at a flat rate to all schools, the biggest buyers are also the biggest losers. In 2014, these areas spent a total of $423 million on lottery tickets, but less than 3% of that money was returned to their local schools. That meant a collective loss of almost $5,900 per student.
Nearly Every One a Loser
The lottery isn’t meant to be a casino, where a few win big but the odds are always stacked in favor of the house. It’s a government program whose stated purpose is to maximize public education funding—and by that yardstick, the lottery does a pretty poor job. Even worse, this program wrings an outsize share of its revenue from poor neighborhoods.
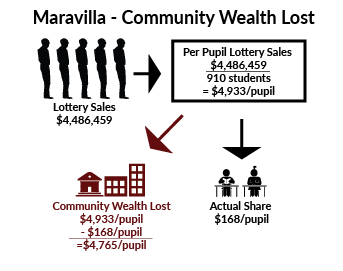
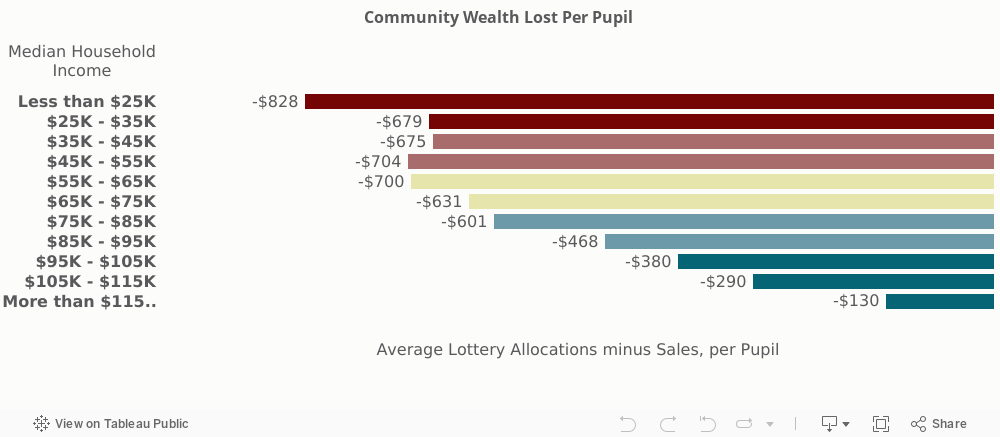
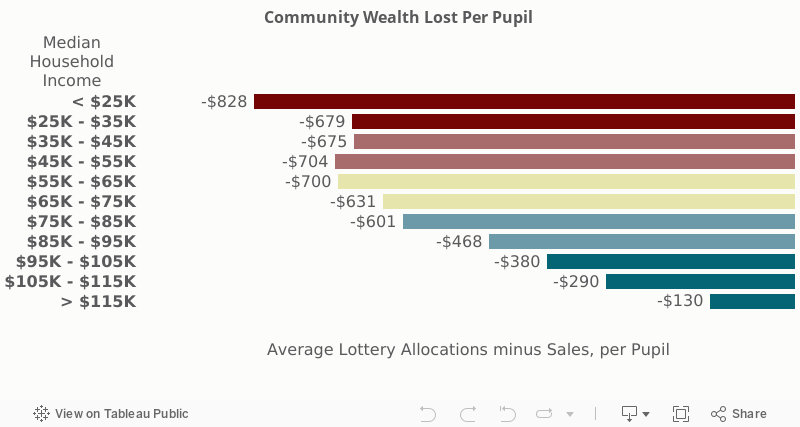
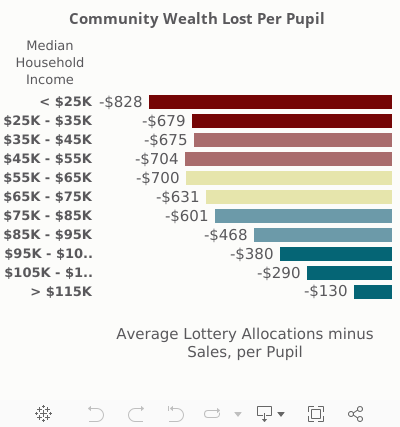
Though the vast majority of neighborhoods in California pay more into the lottery than they get back in education funding, the losses are not spread evenly over the state. The chart below calculates the average losses for each income group in the state—the total lottery sales in each census tract minus the estimated lottery allocations. As you can see from the chart below, communities at every income level come out behind, but the lowest–income communities are, by and large, losing the most. This is powerfully illustrated by the case of a single census tract in Maravilla, a high–poverty neighborhood in east Los Angeles where a many lottery tickets are sold and fewer than half of students graduate from high school. The diagram to the right shows how, in 2014, this community lost $4,765 per pupil to the lottery.
A Fairer Return on Investment
Because poor communities pay so much more into the lottery than wealthy ones, and because the current system of allocations does not take into account neighborhoods’ levels of investment, low–income areas get shortchanged, while affluent ones are radically overpaid. A fairer system of allocations would look very different.
Under California’s current system of lottery allocations, communities at different wealth levels put very dissimilar amounts of money into the lottery for every dollar they get back. The highest–income areas invest $1.80 for every dollar they get in education funding through the lottery. California’s poorest communities, though, are paying out $6.00 for every one dollar they receive.
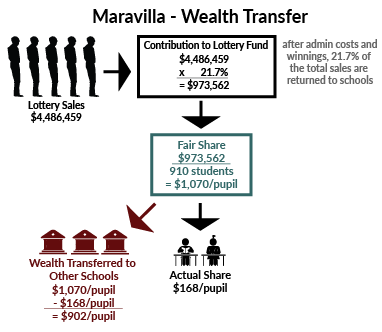
But what if the state took a different approach? How much would each neighborhood receive if lottery money proceeds were allocated back to communities in proportion to their spending on lottery tickets? Statewide, 21.7% of lottery revenue ended up in K-12 public education in 2014. If Maravilla had received 21.7% of its own lottery outlays back in education funding in 2014, it would have gotten $971,318—over $1,000 per student. Under the actual system, it got less than $153,000 in total. On the other end of the spectrum, Pacific Palisades, a wealthy neighborhood just north of Santa Monica, would have received just over $4,000 in all, or $6.38 per pupil, instead of the $107,450 it was given.
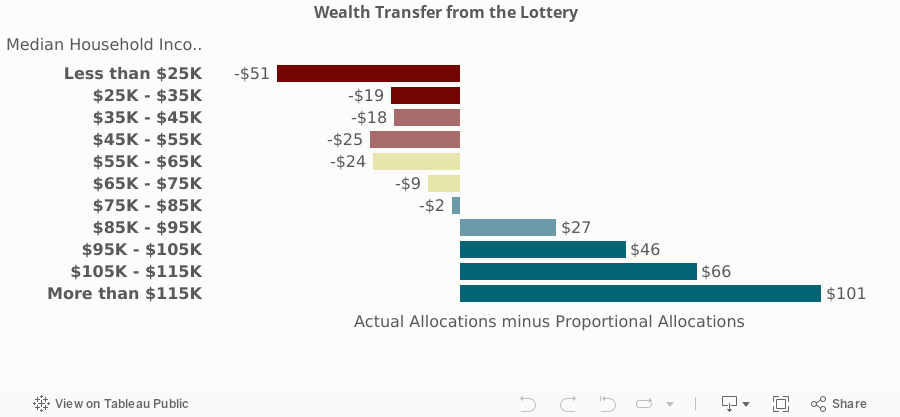
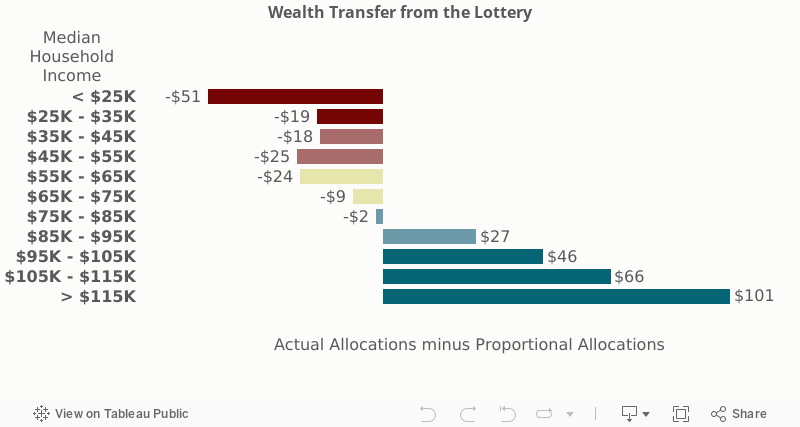
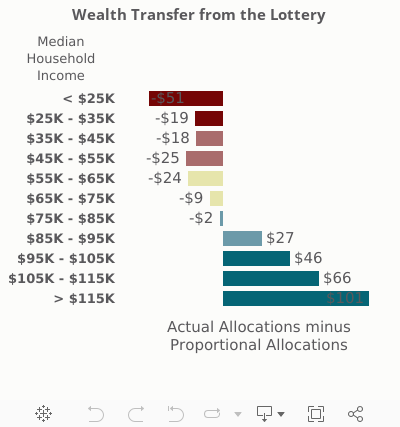
Comparing how much each community would receive under a fairer distribution system with what California doles out now, it’s clear that, across the state, poorer areas are once again getting especially shortchanged, while affluent neighborhoods receive a big boost. As you can see in the chart below, the lowest–income communities are getting an average of $51 less per student than they would if allocations were commensurate with lottery spending, and the wealthiest are getting $101 more.
Because a community’s level of investment in the California lottery bears no relationship to its return in education funding, money is effectively transferred from poor school districts to wealthy ones. The situation is starkest in areas where wealth and poverty collide. As EdBuild showed with the Dividing Lines map of school district poverty rates, 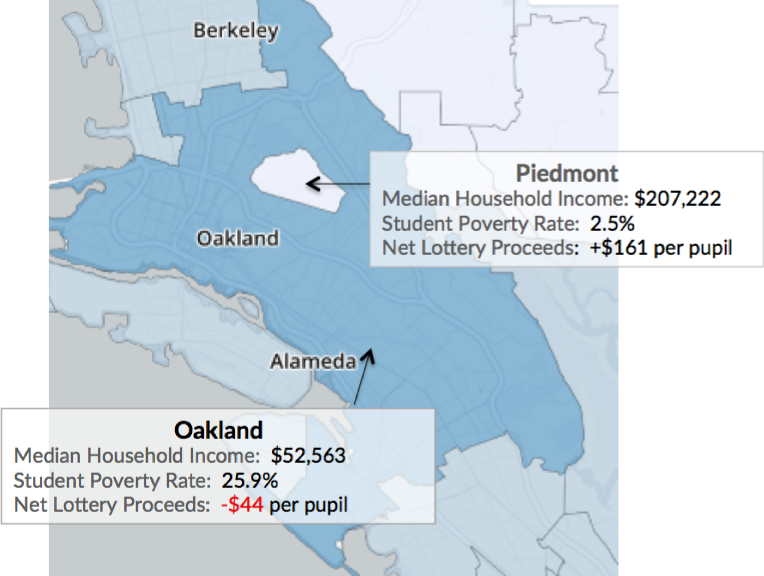 which highlights the destructive impact of the American education funding system overall (of which lotteries are a part), there are many school district borders that segregate sharply by socioeconomic status. One of the most poignant examples is Oakland, a high–poverty California district, which has a hole carved out of its center: the well–to–do Piedmont City, which has a median household income almost four times that of Oakland.
When we compare what Oakland would earn in lottery funding under a fairer system with what it actually receives, we find that the district is losing out on over $2.3 million in total funding. Piedmont, meanwhile, gets almost $445,000 more than it would if the state distributed the funding in proportion to local lottery spending. This amounts to a transfer of $44 per pupil out of Oakland which serves higher-need students, into a system that overpays wealthy Piedmont City by $161 per pupil.
Compounding Urban Inequalities
California’s already-struggling urban school districts see huge losses to the state lottery.
Below, you’ll find maps of the school districts serving six major California metropolitan areas, divided into their census tracts. Choose a school district to see its neighborhoods, shaded by income level, and see how much each of those neighborhoods spends on lottery tickets. The taller the spire, the higher the sales per capita. Select “2D MAP” and click the individual tracts to learn more about the lottery losses and gains in each community.
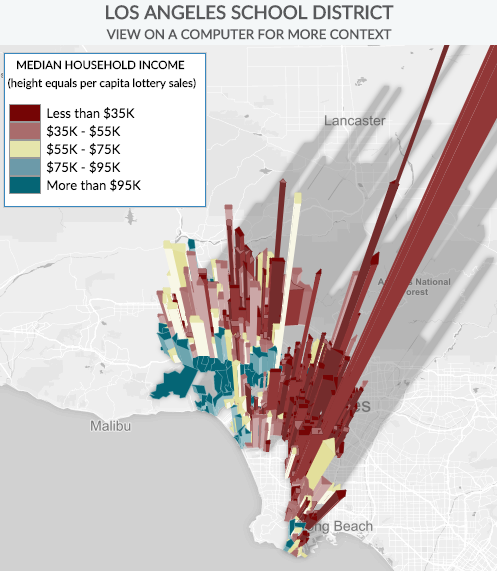
In Los Angeles, one red census tract soars above the rest. That’s West Compton. If the neighborhood were to run its own lottery, even with the same costs and inefficiencies of the state lottery, its schools would get more than 16 times as much lottery money from the program, just by keeping locally raised lottery profits for local classrooms.[3] And if all West Compton residents instead gave their ticket money directly to their neighborhood schools, they would raise $11,637 per student; that’s instead of the $163 per student they get by paying it to the State Lottery Commission. Some neighborhoods do even worse. One census tract just south of downtown San Jose, whose residents hover around the federal poverty line, loses about $15,200 per student on the lottery—more than the entire 2013 per-student budget of its local school district, East Side Union High.
Who, then, benefits from all of this lottery spending? Mostly those living in neighborhoods with no lottery retailers at all—just one–fifth of California’s 7,900 census tracts, represented in these city maps by the areas that remain completely flat. As you can see, they’re almost entirely upper—income neighborhoods (depicted in blue). As is so often the case with education finance mechanisms, those comparatively wealthy places are the ones that come out ahead in lottery funding, with their gains drawn largely from the outlays in low-income neighborhoods.
Mapping Wins and Losses
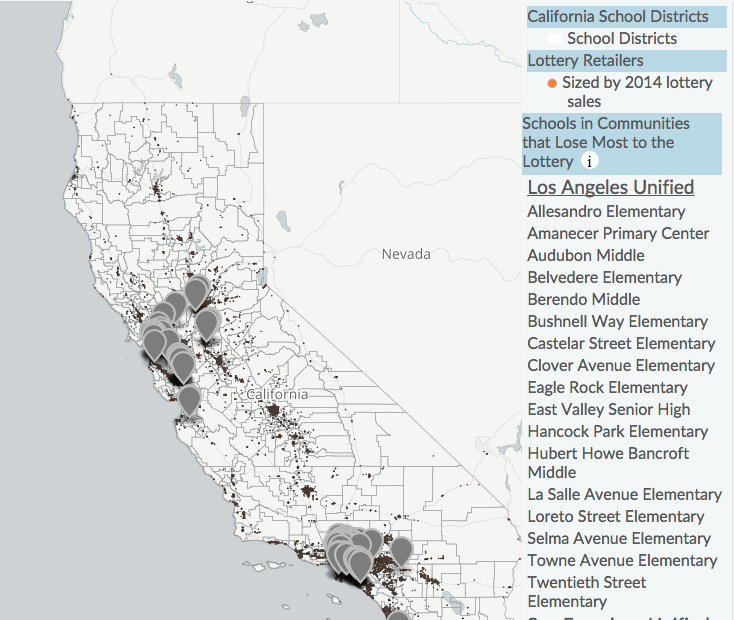
The map below highlights schools in some of the neighborhoods hardest hit by the lottery.
The map below highlights schools in some of the neighborhoods hardest hit by the lottery. Click on the school districts to learn more about their losses or gains from the lottery. It also shows the location and total sales for every lottery retailer in the state—ZOOM IN to see the retailers most clearly. Though they broadly cluster along major highways and in population centers, they do not tend to fall in upper-income areas. The gray markers are the public schools that are located in the census tracts that lose the most money per pupil to the lottery program.[4] Click on any school in the legend to zoom to the school and learn about the lottery sales in its surrounding community.
The Lottery, Fair Funding, and Neighborhood Schools
Most public schools in America are part and parcel of their neighborhoods. They serve local students, whatever their needs and advantages; they engage with community parents; they attract—or fail to attract—families to the area; and they draw, to varying extents, on local financial resources. When a government program draws money out of the community, it by nature hurts neighborhood schools. Impoverishment of communities in the name of aiding public education makes no sense, and doing so in a way that primarily benefits wealthier areas at the expense of those that struggle the most is worse than self–defeating – it’s cruel, and it’s bad policy.
A healthy way of financing schools will recognize that greater needs have to be met with correspondingly greater resources, and that those resources can’t be funded with money money pulled out of struggling neighborhoods. The California lottery does the reverse on both counts, mirroring the injustice of state education funding systems across the country. As EdBuild’s previous work has shown, in most states, more education dollars go to rich and middle-class districts than to poor ones, and funding schemes fail to address low–income students’ unique challenges. When that happens, needy communities are forced to pay a higher proportion of their incomes into the school system than the wealthy do in order to keep their schools alive. This kind of regressive system harms both poor students and their neighborhoods, and school systems end up reproducing inequality for the next generation. That doesn’t sound like a winning approach.
School District Lottery Statistics
(click on column name to sort)
| Name | Average Daily Attendance | Total Gain/Loss to Lottery |
Difference Current Allocations vs "Fairer" Allocations | Difference Current Allocations vs "Fairer" Allocations Per Pupil | Median Household Income |
|---|---|---|---|---|---|
| Baker Valley Unified School District | 181 | -$21,931,805 | -$4,715,545 | -$26,053 | $33,750 |
| Death Valley Unified School District | 31 | -$1,149,646 | -$247,728 | -$7,991 | $33,542 |
| Desert Center Unified School District | 15 | -$85,364 | -$17,362 | -$1,157 | $27,031 |
| Alpine County Unified School District | 147 | -$807,390 | -$153,779 | -$1,046 | $58,636 |
| Alhambra Unified (9-12) School District | 5,361 | -$20,718,366 | -$3,801,786 | -$709 | $45,673 |
| Sierra-Plumas Joint Unified School District | 419 | -$1,397,711 | -$249,734 | -$596 | $40,453 |
| Trinity Alps Unified School District in Lewiston | 53 | -$122,372 | -$20,132 | -$380 | $38,309 |
| Emery Unified School District | 725 | -$1,686,051 | -$269,847 | -$372 | $65,000 |
| San Francisco Unified School District | 57,999 | -$120,972,355 | -$18,656,618 | -$322 | $75,604 |
| South San Francisco Unified School District | 9,999 | -$17,035,392 | -$2,418,931 | -$242 | $80,679 |
| Glendale Unified School District | 26,309 | -$43,179,250 | -$5,979,337 | -$227 | $56,343 |
| Garden Grove Unified School District | 51,877 | -$81,906,396 | -$11,119,777 | -$214 | $58,889 |
| Sunol Glen Unified School District | 276 | -$443,699 | -$59,076 | -$214 | $86,250 |
| Big Creek Elementary School District | 55 | -$88,965 | -$11,697 | -$213 | $77,250 |
| Inglewood Unified School District | 16,352 | -$25,717,125 | -$3,454,908 | -$211 | $46,482 |
| Gonzales Unified (9-12) School District | 332 | -$502,968 | -$66,879 | -$201 | $64,583 |
| Big Oak Flat-Groveland Unified School District | 361 | -$530,022 | -$72,266 | -$200 | $48,765 |
| San Leandro Unified School District | 9,716 | -$14,635,869 | -$1,932,603 | -$199 | $62,360 |
| El Tejon Unified School District | 796 | -$1,136,180 | -$155,595 | -$195 | $57,514 |
| Dunsmuir Joint Union High School District | 291 | -$430,642 | -$56,503 | -$194 | $31,821 |
| Needles Unified School District | 819 | -$1,180,702 | -$158,540 | -$194 | $29,569 |
| Huntington Beach Union High School District | 43,633 | -$63,616,217 | -$8,189,489 | -$188 | $75,488 |
| Barstow Unified School District | 5,832 | -$8,105,261 | -$1,015,278 | -$174 | $46,543 |
| Santa Cruz City High School District | 5,725 | -$7,980,152 | -$981,718 | -$171 | $62,756 |
| Cayucos Elementary School District | 228 | -$296,528 | -$35,717 | -$157 | $58,566 |
| Pasadena Unified School District | 19,289 | -$24,631,123 | -$2,876,076 | -$149 | $73,292 |
| Southern Humboldt Joint Unified School District | 739 | -$930,500 | -$105,940 | -$143 | $35,446 |
| Jefferson Union High School District | 15,952 | -$19,700,995 | -$2,228,689 | -$140 | $78,417 |
| Monterey Peninsula Unified School District | 12,012 | -$14,701,369 | -$1,686,176 | -$140 | $59,631 |
| Culver City Unified School District | 7,402 | -$9,092,914 | -$1,026,621 | -$139 | $77,165 |
| Carpinteria Unified School District | 2,291 | -$2,713,872 | -$297,844 | -$130 | $71,534 |
| John Swett Unified School District | 1,588 | -$1,884,584 | -$196,992 | -$124 | $69,992 |
| Cabrillo Unified School District | 3,330 | -$3,834,066 | -$403,598 | -$121 | $106,323 |
| Mountain Valley Unified School District | 381 | -$442,796 | -$46,047 | -$121 | $32,684 |
| Vallejo City Unified School District | 16,232 | -$18,391,339 | -$1,906,349 | -$117 | $58,135 |
| El Monte Union High School District | 36,884 | -$41,384,022 | -$4,288,864 | -$116 | $43,089 |
| Mendota Unified School District | 2,907 | -$3,310,711 | -$335,652 | -$115 | $25,204 |
| Alhambra Unified School District | 20,735 | -$23,028,597 | -$2,348,144 | -$113 | $54,759 |
| Lone Pine Unified School District | 394 | -$444,348 | -$43,634 | -$111 | $36,750 |
| Calistoga Joint Unified School District | 825 | -$911,181 | -$91,003 | -$110 | $60,460 |
| Santa Monica-Malibu Unified School District | 11,519 | -$12,746,988 | -$1,269,799 | -$110 | $79,828 |
| Duarte Unified School District | 3,778 | -$4,065,134 | -$411,713 | -$109 | $61,065 |
| Milpitas Unified School District | 13,396 | -$14,850,324 | -$1,449,855 | -$108 | $95,893 |
| Centinela Valley Union High School District | 29,133 | -$31,763,025 | -$3,080,729 | -$106 | $45,435 |
| San Gabriel Unified School District | 6,432 | -$6,870,302 | -$676,203 | -$105 | $61,121 |
| Santa Clara Unified School District | 17,659 | -$18,751,079 | -$1,799,279 | -$102 | $92,122 |
| Anaheim Union High School District | 53,335 | -$56,292,630 | -$5,398,582 | -$101 | $57,464 |
| El Rancho Unified School District | 10,909 | -$11,387,322 | -$1,105,140 | -$101 | $58,136 |
| Gustine Unified School District | 1,754 | -$1,847,678 | -$171,877 | -$98 | $33,674 |
| San Lorenzo Unified School District | 13,449 | -$14,084,252 | -$1,306,379 | -$97 | $59,301 |
| Newark Unified School District | 7,053 | -$6,911,508 | -$602,867 | -$85 | $85,847 |
| Bear Valley Unified School District | 2,602 | -$2,512,697 | -$219,529 | -$84 | $39,413 |
| Siskiyou Union High School District | 1,840 | -$1,759,101 | -$153,179 | -$83 | $42,019 |
| Burbank Unified School District | 17,485 | -$16,920,766 | -$1,430,412 | -$82 | $66,240 |
| Norwalk-La Mirada Unified School District | 22,349 | -$21,398,531 | -$1,801,554 | -$81 | $65,626 |
| East Side Union High School District | 100,813 | -$97,880,898 | -$8,075,514 | -$80 | $80,565 |
| Bonita Unified School District | 10,250 | -$9,706,142 | -$784,759 | -$77 | $77,433 |
| Mojave Unified School District | 2,603 | -$2,455,431 | -$200,289 | -$77 | $43,537 |
| Newport-Mesa Unified School District | 23,321 | -$22,035,652 | -$1,781,677 | -$76 | $81,252 |
| Trona Joint Unified School District | 264 | -$243,648 | -$20,170 | -$76 | $31,118 |
| Fort Bragg Unified School District | 1,885 | -$1,779,008 | -$141,364 | -$75 | $41,488 |
| Torrance Unified School District | 28,997 | -$27,086,996 | -$2,140,293 | -$74 | $77,418 |
| Sonoma Valley Unified School District | 4,833 | -$4,496,481 | -$350,495 | -$73 | $58,902 |
| Covina-Valley Unified School District | 15,929 | -$14,581,431 | -$1,133,634 | -$71 | $66,242 |
| Big Pine Unified School District | 175 | -$152,215 | -$12,170 | -$70 | $51,125 |
| Morgan Hill Unified School District | 9,445 | -$8,629,739 | -$657,870 | -$70 | $95,298 |
| Fillmore Unified School District | 3,805 | -$3,432,311 | -$257,721 | -$68 | $56,922 |
| Klamath-Trinity Joint Unified School District | 964 | -$856,362 | -$65,593 | -$68 | $31,850 |
| Washington Unified School District | 7,749 | -$7,073,953 | -$527,217 | -$68 | $53,394 |
| Acton-Agua Dulce Unified School District | 1,682 | -$1,607,925 | -$107,297 | -$64 | $90,759 |
| San Jose Unified School District | 36,409 | -$32,180,201 | -$2,304,347 | -$63 | $81,025 |
| Washington Unified School District (9-12) | 1,821 | -$1,584,582 | -$114,179 | -$63 | $40,362 |
| Temple City Unified School District | 6,069 | -$5,369,837 | -$372,666 | -$61 | $62,487 |
| Los Angeles Unified School District | 831,065 | -$709,241,272 | -$47,680,539 | -$57 | $49,083 |
| San Mateo Union High School District | 31,964 | -$27,378,121 | -$1,772,930 | -$55 | $90,995 |
| Southern Kern Unified School District | 3,007 | -$2,526,134 | -$162,899 | -$54 | $57,340 |
| Simi Valley Unified School District | 21,651 | -$17,855,533 | -$1,153,160 | -$53 | $87,215 |
| Brea-Olinda Unified School District | 6,206 | -$5,171,556 | -$325,671 | -$52 | $79,120 |
| Compton Unified School District | 27,390 | -$22,792,477 | -$1,420,606 | -$52 | $43,861 |
| Point Arena Joint Union High School District | 607 | -$504,459 | -$31,421 | -$52 | $43,602 |
| Vacaville Unified School District | 12,838 | -$10,691,581 | -$649,340 | -$51 | $71,397 |
| Linden Unified School District | 2,340 | -$1,919,424 | -$117,082 | -$50 | $63,162 |
| New Haven Unified School District | 13,942 | -$11,476,078 | -$703,045 | -$50 | $81,885 |
| Campbell Union High School District | 31,882 | -$26,274,511 | -$1,575,493 | -$49 | $86,187 |
| Bellflower Unified School District | 14,888 | -$11,893,704 | -$691,101 | -$46 | $55,613 |
| Ventura Unified School District | 19,120 | -$15,348,355 | -$883,594 | -$46 | $65,489 |
| Alameda City Unified School District | 11,714 | -$9,407,805 | -$516,723 | -$44 | $74,606 |
| Monrovia Unified School District | 6,888 | -$5,456,141 | -$300,824 | -$44 | $71,828 |
| Oakland Unified School District | 54,716 | -$43,744,074 | -$2,387,589 | -$44 | $52,563 |
| Mariposa County Unified School District | 1,856 | -$1,416,456 | -$77,846 | -$42 | $50,318 |
| Taft Union High School District | 3,642 | -$2,814,389 | -$152,935 | -$42 | $44,679 |
| Rim of the World Unified School District | 3,941 | -$2,968,959 | -$150,589 | -$38 | $54,553 |
| San Pasqual Valley Unified School District | 756 | -$574,870 | -$28,393 | -$38 | $29,764 |
| Healdsburg Unified School District | 1,858 | -$1,363,059 | -$68,219 | -$37 | $59,265 |
| Twin Rivers Unified School District in Robla | 2,107 | -$1,633,221 | -$78,336 | -$37 | $46,427 |
| Esparto Unified School District | 937 | -$683,147 | -$33,797 | -$36 | $66,500 |
| Montebello Unified School District | 36,406 | -$27,230,086 | -$1,311,484 | -$36 | $44,850 |
| Trinity Alps Unified School District | 829 | -$612,943 | -$29,808 | -$36 | $40,366 |
| Palo Verde Unified School District | 3,293 | -$2,406,858 | -$115,468 | -$35 | $42,799 |
| Paso Robles Joint Unified School District | 6,659 | -$4,905,997 | -$232,136 | -$35 | $63,048 |
| Rowland Unified School District | 16,961 | -$12,597,147 | -$600,172 | -$35 | $63,069 |
| El Segundo Unified School District | 3,652 | -$2,789,297 | -$122,515 | -$34 | $84,341 |
| Gilroy Unified School District | 11,538 | -$8,711,731 | -$372,877 | -$32 | $81,051 |
| Azusa Unified School District | 11,521 | -$8,215,252 | -$350,895 | -$30 | $56,649 |
| North Monterey County Unified School District | 4,524 | -$3,254,612 | -$134,435 | -$30 | $66,364 |
| Sierra Sands Unified School District | 5,389 | -$3,927,616 | -$160,565 | -$30 | $59,989 |
| Antioch Unified School District | 18,704 | -$13,539,600 | -$546,497 | -$29 | $64,761 |
| Redondo Beach Unified School District | 10,426 | -$7,699,609 | -$297,158 | -$29 | $99,496 |
| Twin Rivers Unified School District in Elverta | 311 | -$248,085 | -$8,973 | -$29 | $65,938 |
| San Rafael City High School District | 9,641 | -$7,093,655 | -$265,642 | -$28 | $80,255 |
| Mount Diablo Unified School District | 41,918 | -$29,915,507 | -$1,102,865 | -$26 | $74,027 |
| Hayward Unified School District | 30,077 | -$21,774,212 | -$743,752 | -$25 | $61,379 |
| River Delta Joint Unified School District | 2,328 | -$1,665,513 | -$58,841 | -$25 | $56,162 |
| Cloverdale Unified School District | 1,430 | -$1,002,747 | -$34,927 | -$24 | $57,786 |
| Amador County Unified School District | 4,238 | -$2,917,069 | -$96,799 | -$23 | $53,684 |
| Los Alamitos Unified School District | 10,194 | -$7,177,992 | -$230,673 | -$23 | $68,520 |
| West Contra Costa Unified School District | 31,581 | -$22,356,735 | -$728,050 | -$23 | $62,744 |
| Novato Unified School District | 8,138 | -$5,684,102 | -$179,519 | -$22 | $80,520 |
| ABC Unified School District | 25,826 | -$17,695,032 | -$499,708 | -$19 | $71,818 |
| Los Molinos Unified School District | 569 | -$387,012 | -$10,903 | -$19 | $36,369 |
| San Luis Coastal Unified School District | 8,969 | -$6,149,993 | -$170,681 | -$19 | $52,155 |
| Konocti Unified School District | 2,945 | -$1,957,358 | -$51,831 | -$18 | $28,132 |
| Martinez Unified School District | 5,270 | -$3,548,384 | -$97,374 | -$18 | $71,651 |
| Mountain View-Los Altos Union School District | 14,985 | -$10,246,765 | -$277,194 | -$18 | $109,297 |
| Sacramento City Unified School District | 53,058 | -$35,380,396 | -$913,616 | -$17 | $47,353 |
| Glendora Unified School District | 7,974 | -$5,262,921 | -$109,530 | -$14 | $76,717 |
| Gonzales Unified School District | 2,516 | -$1,694,649 | -$33,968 | -$14 | $51,642 |
| Oakdale Joint Unified School District | 5,376 | -$3,504,452 | -$67,935 | -$13 | $61,130 |
| Tehachapi Unified School District | 4,331 | -$2,763,890 | -$52,534 | -$12 | $57,729 |
| Whittier Union High School District | 41,822 | -$26,874,710 | -$505,546 | -$12 | $65,090 |
| Caruthers Unified School District | 1,382 | -$894,492 | -$14,917 | -$11 | $47,063 |
| Santa Ana Unified School District | 56,171 | -$36,249,554 | -$627,620 | -$11 | $54,616 |
| Lincoln Unified School District | 9,058 | -$5,880,684 | -$90,886 | -$10 | $55,395 |
| Upland Unified School District | 12,166 | -$7,720,494 | -$115,253 | -$9 | $65,091 |
| Cotati-Rohnert Park Unified School District | 5,879 | -$3,659,927 | -$45,459 | -$8 | $57,949 |
| Lake Tahoe Unified School District | 3,845 | -$2,400,290 | -$32,576 | -$8 | $46,795 |
| Morongo Unified School District | 8,656 | -$5,334,801 | -$69,812 | -$8 | $39,585 |
| Paramount Unified School District | 17,121 | -$10,778,183 | -$117,200 | -$7 | $45,666 |
| Santa Barbara Unified School District (7-12) | 7,282 | -$4,446,158 | -$46,065 | -$6 | $72,217 |
| Dixon Unified School District | 3,904 | -$2,335,785 | -$15,548 | -$4 | $72,540 |
| Livermore Valley Joint Unified School District | 13,712 | -$8,533,378 | -$50,525 | -$4 | $100,474 |
| Bret Harte Union High School District | 3,038 | -$1,827,014 | -$9,246 | -$3 | $53,253 |
| Long Beach Unified School District | 83,610 | $37,043 | $37,049 | $0 | $55,527 |
| San Juan Unified School District | 49,160 | -$28,874,522 | $69,424 | $1 | $54,021 |
| Lucia Mar Unified School District | 11,033 | -$6,419,659 | $24,475 | $2 | $58,500 |
| Paradise Unified School District | 4,209 | -$2,407,546 | $7,355 | $2 | $40,480 |
| Atascadero Unified School District | 4,913 | -$2,779,000 | $15,081 | $3 | $65,503 |
| Benicia Unified School District | 4,936 | -$2,810,373 | $17,012 | $3 | $88,741 |
| Calaveras Unified School District | 3,170 | -$1,769,681 | $10,998 | $3 | $56,836 |
| Eureka City Unified School District | 6,212 | -$3,524,926 | $20,413 | $3 | $39,317 |
| Fairfield-Suisun Unified School District | 24,085 | -$13,942,743 | $60,907 | $3 | $65,977 |
| Placentia-Yorba Linda Unified School District | 26,796 | -$15,452,453 | $72,413 | $3 | $86,857 |
| Chino Valley Unified School District | 32,100 | -$18,160,004 | $113,777 | $4 | $81,393 |
| Lynwood Unified School District | 15,952 | -$8,883,309 | $69,291 | $4 | $40,765 |
| Turlock Unified School District | 14,060 | -$8,130,618 | $70,557 | $5 | $52,006 |
| Conejo Valley Unified School District | 21,781 | -$12,147,640 | $140,691 | $6 | $101,341 |
| Maricopa Unified School District | 333 | -$215,981 | $1,984 | $6 | $37,125 |
| Modesto City High School District | 53,666 | -$30,448,221 | $318,158 | $6 | $47,517 |
| Santa Ynez Valley Union High School District | 3,151 | -$1,757,085 | $20,438 | $6 | $77,541 |
| Selma Unified School District | 6,736 | -$3,777,914 | $42,575 | $6 | $44,099 |
| Banning Unified School District | 4,274 | -$2,313,764 | $30,415 | $7 | $38,584 |
| Laytonville Unified School District | 386 | -$215,094 | $2,573 | $7 | $37,050 |
| Oxnard Union High School District | 62,595 | -$35,675,503 | $411,808 | $7 | $66,760 |
| Saddleback Valley Unified School District | 32,907 | -$18,076,746 | $229,805 | $7 | $85,327 |
| Sequoia Union High School District | 38,284 | -$21,687,835 | $280,338 | $7 | $94,593 |
| Winters Joint Unified School District | 1,513 | -$800,840 | $10,035 | $7 | $54,405 |
| Yreka Union High School District | 2,919 | -$1,631,349 | $21,641 | $7 | $34,425 |
| Sonora Union High School District | 4,009 | -$2,188,433 | $32,125 | $8 | $48,235 |
| Coast Unified School District | 798 | -$451,991 | $7,135 | $9 | $56,931 |
| Gateway Unified School District | 4,083 | -$2,261,536 | $36,399 | $9 | $40,518 |
| Upper Lake Union High School District | 1,064 | -$604,193 | $9,623 | $9 | $26,633 |
| Dinuba Unified School District | 6,673 | -$3,683,168 | $70,391 | $11 | $39,301 |
| Dos Palos-Oro Loma Joint Unified School District | 2,368 | -$1,254,128 | $26,231 | $11 | $34,348 |
| Fullerton Joint Union High School District | 44,878 | -$24,219,828 | $505,092 | $11 | $67,282 |
| Scott Valley Unified School District | 689 | -$360,864 | $8,295 | $12 | $43,469 |
| Napa Valley Unified School District | 19,518 | -$10,461,889 | $254,361 | $13 | $69,718 |
| Scotts Valley Unified School District | 2,488 | -$1,321,651 | $31,698 | $13 | $105,923 |
| Pacific Grove Unified School District | 3,105 | -$1,698,585 | $43,804 | $14 | $76,314 |
| San Diego City Unified School District | 148,460 | -$77,817,538 | $2,073,606 | $14 | $59,714 |
| Pajaro Valley Joint Unified School District | 21,065 | -$11,058,772 | $317,977 | $15 | $60,122 |
| Parlier Unified School District | 3,365 | -$1,794,684 | $51,622 | $15 | $35,320 |
| Las Virgenes Unified School District | 11,314 | -$5,782,820 | $182,454 | $16 | $121,069 |
| Fresno Unified School District | 81,779 | -$42,117,604 | $1,352,926 | $17 | $35,065 |
| Santa Rosa High School District | 31,398 | -$17,185,628 | $538,738 | $17 | $60,736 |
| Carlsbad Unified School District | 10,943 | -$5,445,175 | $208,878 | $19 | $76,361 |
| Marysville Joint Unified School District | 10,477 | -$5,282,744 | $194,325 | $19 | $43,146 |
| Palm Springs Unified School District | 23,242 | -$11,587,994 | $448,894 | $19 | $43,942 |
| Ceres Unified School District | 12,850 | -$6,589,575 | $261,451 | $20 | $47,101 |
| Pomona Unified School District | 33,035 | -$16,152,189 | $667,669 | $20 | $54,289 |
| San Benito High School District | 9,960 | -$4,985,593 | $197,407 | $20 | $67,496 |
| William S. Hart Union High School District | 52,711 | -$25,938,061 | $1,110,175 | $21 | $88,577 |
| Geyserville Unified School District | 271 | -$139,046 | $5,849 | $22 | $58,750 |
| Porterville Unified (9-12) School District | 9,262 | $207,061 | $207,187 | $22 | $42,068 |
| Laton Joint Unified School District | 681 | -$332,116 | $15,648 | $23 | $41,360 |
| Coalinga-Huron Joint Unified School District | 4,231 | -$2,043,590 | $103,245 | $24 | $41,790 |
| Fort Sage Unified School District | 299 | -$130,231 | $7,362 | $25 | $42,931 |
| Fremont Unified School District | 37,774 | -$18,393,920 | $937,872 | $25 | $101,535 |
| King City Joint Union High School District | 8,323 | -$4,254,287 | $209,226 | $25 | $51,199 |
| Manteca Unified School District | 23,828 | -$11,277,355 | $596,519 | $25 | $60,555 |
| Plumas Unified School District | 2,392 | -$1,116,029 | $60,335 | $25 | $45,694 |
| Tahoe-Truckee Joint Unified School District | 3,822 | -$1,857,658 | $97,102 | $25 | $63,138 |
| Wasco Union High School District | 6,653 | -$3,204,033 | $168,435 | $25 | $38,569 |
| Grossmont Union High School District | 77,846 | -$36,581,819 | $1,998,224 | $26 | $59,620 |
| Kingsburg Joint Union High School District | 4,707 | -$2,246,396 | $121,326 | $26 | $52,245 |
| Laguna Beach Unified School District | 3,085 | -$1,451,982 | $80,062 | $26 | $85,785 |
| Reef-Sunset Unified School District | 2,682 | -$1,282,109 | $69,520 | $26 | $30,778 |
| West Covina Unified School District | 11,267 | -$5,346,440 | $291,533 | $26 | $69,352 |
| Bassett Unified School District | 6,574 | -$3,020,329 | $180,546 | $27 | $56,851 |
| Dinuba Unified (9-12) in Monson-Sultana Joint Union | 449 | -$209,740 | $12,152 | $27 | $27,045 |
| Arcadia Unified School District | 9,913 | -$4,577,511 | $276,289 | $28 | $80,019 |
| Beverly Hills Unified School District | 4,769 | -$2,159,428 | $132,191 | $28 | $85,696 |
| Merced Union High School District | 37,515 | -$17,066,740 | $1,067,854 | $28 | $42,135 |
| Chawanakee Unified School District | 1,059 | -$493,841 | $30,290 | $29 | $49,583 |
| Eastern Sierra Unified School District | 800 | -$426,683 | $23,349 | $29 | $51,121 |
| Hermosa Beach City Elementary School District | 2,743 | -$1,326,986 | $79,672 | $29 | $101,655 |
| Kings Canyon Joint Unified School District | 10,564 | -$4,932,153 | $304,786 | $29 | $42,199 |
| Orange Unified School District | 49,256 | -$22,234,585 | $1,429,482 | $29 | $82,701 |
| Apple Valley Unified School District | 14,474 | -$6,479,859 | $437,593 | $30 | $48,838 |
| Berkeley Unified School District | 11,626 | -$5,448,156 | $344,159 | $30 | $63,429 |
| Hesperia Unified School District | 23,309 | -$10,702,100 | $692,891 | $30 | $46,360 |
| Newman-Crows Landing Unified School District | 2,888 | -$1,319,773 | $90,634 | $31 | $48,084 |
| Black Oak Mine Unified School District | 1,507 | -$595,838 | $48,723 | $32 | $71,326 |
| Dublin Unified School District | 7,801 | -$3,806,900 | $247,612 | $32 | $114,507 |
| Calipatria Unified School District | 1,220 | -$526,692 | $40,667 | $33 | $28,671 |
| Chaffey Joint Union High School District | 80,701 | -$35,530,599 | $2,626,695 | $33 | $64,738 |
| Lodi Unified School District | 30,554 | -$13,412,967 | $1,004,833 | $33 | $55,141 |
| Placer Union High School District | 15,552 | -$6,903,410 | $511,794 | $33 | $64,228 |
| Alvord Unified School District | 19,519 | -$8,371,263 | $673,312 | $34 | $56,907 |
| Charter Oak Unified School District | 6,959 | -$2,919,687 | $238,427 | $34 | $71,980 |
| Chowchilla Union High School District | 3,633 | -$1,636,457 | $123,105 | $34 | $40,201 |
| Antelope Valley Union Joint High School District | 80,131 | -$34,333,455 | $2,856,748 | $36 | $52,254 |
| Oceanside Unified School District | 20,965 | -$9,027,040 | $748,371 | $36 | $53,431 |
| Cutler-Orosi Joint Unified School District | 4,275 | -$1,799,978 | $160,064 | $37 | $33,287 |
| Jurupa Unified School District | 19,882 | -$8,181,947 | $745,002 | $37 | $56,695 |
| Fremont Union High School District | 38,316 | -$16,097,337 | $1,498,711 | $39 | $109,575 |
| Hemet Unified School District | 21,298 | -$8,506,228 | $838,818 | $39 | $37,991 |
| Escalon Unified School District | 2,857 | -$1,152,266 | $114,781 | $40 | $56,604 |
| Fowler Unified School District | 2,393 | -$1,006,200 | $95,024 | $40 | $38,586 |
| Lakeport Unified School District | 1,957 | -$780,285 | $77,673 | $40 | $43,363 |
| Salinas Union High School District | 41,908 | -$17,432,748 | $1,692,955 | $40 | $53,697 |
| Santa Barbara Unified School District | 15,196 | -$6,295,805 | $604,780 | $40 | $67,296 |
| Woodland Joint Unified School District | 11,377 | -$4,546,958 | $457,586 | $40 | $55,635 |
| Muroc Joint Unified School District | 2,030 | -$785,830 | $82,325 | $41 | $41,786 |
| Porterville Unified School District | 15,307 | -$6,213,498 | $625,202 | $41 | $37,135 |
| Twin Rivers Unified School District | 33,610 | -$13,573,093 | $1,390,086 | $41 | $40,718 |
| Delano Joint Union High School District | 15,913 | -$6,235,508 | $673,664 | $42 | $33,300 |
| Mammoth Unified School District | 1,133 | -$439,422 | $48,023 | $42 | $70,789 |
| Stockton Unified School District | 46,030 | -$18,608,434 | $1,914,684 | $42 | $37,209 |
| Yucaipa-Calimesa Joint Unified School District | 10,400 | -$4,156,430 | $436,425 | $42 | $57,955 |
| Claremont Unified School District | 8,005 | -$3,126,962 | $347,978 | $43 | $78,734 |
| Natomas Unified School District | 12,542 | -$5,029,102 | $541,296 | $43 | $66,323 |
| Patterson Joint Unified School District | 5,892 | -$2,420,524 | $251,790 | $43 | $51,326 |
| Anderson Union High School District | 5,712 | -$2,175,030 | $250,536 | $44 | $45,117 |
| Bishop Unified School District | 2,028 | -$755,770 | $91,813 | $45 | $49,826 |
| Chico Unified School District | 13,751 | -$5,374,432 | $620,684 | $45 | $46,080 |
| Kern Union High School District | 135,266 | -$52,758,205 | $6,051,130 | $45 | $49,023 |
| Pierce Joint Unified School District | 1,380 | -$550,682 | $62,341 | $45 | $54,063 |
| Round Valley Unified School District | 370 | -$143,023 | $16,815 | $45 | $27,684 |
| Santa Maria Joint Union High School District | 30,086 | -$11,745,110 | $1,380,762 | $46 | $54,708 |
| Tustin Unified School District | 24,781 | -$9,611,676 | $1,132,080 | $46 | $83,035 |
| Yuba City Unified School District | 15,013 | -$5,696,863 | $691,476 | $46 | $50,298 |
| Hacienda La Puente Unified School District | 32,029 | -$12,733,251 | $1,511,337 | $47 | $67,424 |
| Lake Elsinore Unified School District | 22,193 | -$8,328,569 | $1,048,556 | $47 | $62,190 |
| Colton Joint Unified School District | 23,580 | -$8,710,090 | $1,123,888 | $48 | $50,250 |
| Lompoc Unified School District | 9,896 | -$3,649,925 | $479,650 | $48 | $53,057 |
| St. Helena Unified School District | 1,352 | -$491,357 | $66,033 | $49 | $84,457 |
| Carmel Unified School District | 2,771 | -$1,005,250 | $137,579 | $50 | $96,673 |
| Corona-Norco Unified School District | 54,412 | -$19,713,679 | $2,703,870 | $50 | $84,315 |
| Galt Joint Union High School District | 7,198 | -$2,572,474 | $357,975 | $50 | $61,079 |
| West Sonoma County Union High School District | 7,480 | -$3,083,648 | $371,177 | $50 | $60,592 |
| Delhi Unified School District | 2,725 | -$992,499 | $138,902 | $51 | $46,570 |
| McFarland Unified School District | 3,316 | -$1,175,357 | $169,129 | $51 | $35,577 |
| Tracy Unified School District | 21,934 | -$8,000,449 | $1,125,487 | $51 | $70,656 |
| Ojai Unified School District | 4,110 | -$1,458,122 | $213,030 | $52 | $66,449 |
| Petaluma Joint Union High School District | 11,955 | -$4,937,176 | $627,041 | $52 | $79,205 |
| Red Bluff Joint Union High School District | 7,093 | -$2,444,214 | $366,341 | $52 | $43,066 |
| Firebaugh-Las Deltas Joint Unified School District | 2,427 | -$879,913 | $128,466 | $53 | $32,743 |
| Fortuna Union High School District | 3,512 | -$1,139,383 | $185,921 | $53 | $42,048 |
| Hilmar Unified School District | 2,226 | -$740,033 | $118,863 | $53 | $50,533 |
| Sweetwater Union High School District | 94,753 | -$33,263,644 | $5,016,287 | $53 | $56,257 |
| Willits Unified School District | 1,877 | -$643,986 | $98,682 | $53 | $39,943 |
| Elk Grove Unified School District | 63,317 | -$21,721,049 | $3,418,096 | $54 | $65,302 |
| Live Oak Unified School District | 1,735 | -$576,283 | $93,449 | $54 | $45,074 |
| Redlands Unified School District | 22,877 | -$7,826,199 | $1,224,367 | $54 | $67,693 |
| Santa Cruz City High School District (9-12) in Soquel | 9,695 | -$3,367,504 | $526,362 | $54 | $63,594 |
| Shoreline Unified School District | 544 | -$168,851 | $29,168 | $54 | $52,275 |
| Baldwin Park Unified School District | 23,306 | -$7,887,071 | $1,275,026 | $55 | $51,293 |
| Exeter Unified School District | 3,451 | -$1,133,212 | $190,454 | $55 | $44,689 |
| Keyes Union Elementary School District | 1,104 | -$369,113 | $61,184 | $55 | $33,961 |
| Ripon Unified School District | 3,265 | -$1,193,490 | $178,075 | $55 | $71,857 |
| Shasta Union High School District | 16,919 | -$5,691,306 | $926,126 | $55 | $46,669 |
| Gridley Unified School District | 2,116 | -$729,921 | $117,808 | $56 | $43,431 |
| Riverbank Unified School District | 2,787 | -$924,840 | $159,636 | $57 | $42,165 |
| Ukiah Unified School District | 7,952 | -$2,554,016 | $456,282 | $57 | $50,140 |
| Brawley Union High School District | 6,406 | -$2,073,608 | $375,577 | $59 | $41,734 |
| Silver Valley Unified School District | 2,347 | -$732,425 | $139,242 | $59 | $48,765 |
| Woodlake Unified School District | 2,996 | -$978,929 | $177,475 | $59 | $40,521 |
| Golden Plains Unified School District | 1,929 | -$610,566 | $114,963 | $60 | $29,354 |
| Pittsburg Unified School District | 11,709 | -$3,819,441 | $708,269 | $60 | $53,843 |
| Sanger Unified School District | 11,569 | -$3,680,724 | $689,973 | $60 | $54,549 |
| Beaumont Unified School District | 8,934 | -$2,861,183 | $548,834 | $61 | $61,117 |
| Borrego Springs Unified School District | 508 | -$154,952 | $31,071 | $61 | $40,588 |
| Corcoran Joint Unified School District | 3,267 | -$1,013,966 | $199,649 | $61 | $33,985 |
| Fontana Unified School District | 41,460 | -$12,860,399 | $2,518,697 | $61 | $53,084 |
| Cuyama Joint Unified School District | 249 | -$74,065 | $15,504 | $62 | $33,304 |
| Escondido Union High School District | 30,085 | -$9,284,267 | $1,859,494 | $62 | $52,530 |
| Rialto Unified School District | 26,889 | -$8,130,236 | $1,666,795 | $62 | $49,150 |
| Tulare Joint Union High School District | 20,699 | -$6,420,462 | $1,285,898 | $62 | $43,361 |
| Soledad Unified School District | 5,069 | -$1,568,952 | $317,229 | $63 | $49,508 |
| Albany City Unified School District | 3,992 | -$1,195,414 | $257,205 | $64 | $79,926 |
| Golden Valley Unified School District | 1,956 | -$559,636 | $124,844 | $64 | $75,440 |
| Desert Sands Unified School District | 28,698 | -$8,320,487 | $1,858,033 | $65 | $53,485 |
| Farmersville Unified School District | 2,693 | -$815,051 | $174,701 | $65 | $32,469 |
| Folsom-Cordova Unified School District | 25,874 | -$7,680,877 | $1,691,406 | $65 | $74,535 |
| Madera Unified School District | 22,080 | -$6,538,694 | $1,437,325 | $65 | $43,542 |
| Colusa Unified School District | 1,409 | -$410,379 | $93,227 | $66 | $50,529 |
| Manhattan Beach Unified School District | 7,057 | -$2,064,571 | $468,545 | $66 | $139,259 |
| Moreno Valley Unified School District | 34,699 | -$9,571,892 | $2,286,175 | $66 | $53,921 |
| Los Banos Unified School District | 9,735 | -$2,904,757 | $655,765 | $67 | $46,975 |
| Clovis Unified School District | 41,811 | -$12,087,475 | $2,838,933 | $68 | $71,563 |
| Le Grand Union High School District | 1,835 | -$501,673 | $125,612 | $68 | $36,675 |
| Moorpark Unified School District | 7,084 | -$1,912,404 | $479,822 | $68 | $97,003 |
| Williams Unified School District | 1,309 | -$372,749 | $89,642 | $68 | $53,820 |
| Kerman Unified School District | 4,888 | -$1,376,567 | $339,235 | $69 | $47,811 |
| Leggett Valley Unified School District | 112 | -$28,545 | $7,684 | $69 | $21,444 |
| San Bernardino City Unified School District | 63,068 | -$16,909,257 | $4,382,464 | $69 | $38,769 |
| Yosemite Unified School District in Bass Lake | 3,004 | -$746,729 | $206,739 | $69 | $44,851 |
| El Dorado Union High School District | 22,813 | -$5,963,600 | $1,604,651 | $70 | $75,668 |
| Visalia Unified School District | 32,173 | -$8,959,172 | $2,249,867 | $70 | $51,668 |
| Maxwell Unified School District | 343 | -$75,042 | $24,191 | $71 | $43,352 |
| Riverdale Joint Unified School District | 1,630 | -$434,253 | $115,147 | $71 | $44,325 |
| San Lorenzo Valley Unified School District | 4,541 | -$1,275,105 | $327,455 | $72 | $75,737 |
| South Pasadena Unified School District | 4,696 | -$1,251,838 | $337,754 | $72 | $85,058 |
| Calexico Unified School District | 9,549 | -$2,394,740 | $695,167 | $73 | $35,967 |
| Pleasanton Unified School District | 16,413 | -$4,216,291 | $1,191,627 | $73 | $117,998 |
| Riverside Unified School District | 60,440 | -$15,639,927 | $4,387,442 | $73 | $59,776 |
| Washington Unified School District | 3,096 | -$847,196 | $225,577 | $73 | $32,854 |
| Hughson Unified School District | 2,197 | -$556,513 | $163,582 | $74 | $51,108 |
| Liberty Union High School District | 23,449 | -$6,125,178 | $1,724,758 | $74 | $85,235 |
| Tamalpais Union High School District | 15,386 | -$4,163,703 | $1,130,955 | $74 | $106,822 |
| Windsor Unified School District | 5,489 | -$1,401,046 | $407,002 | $74 | $79,585 |
| Downey Unified School District | 47,280 | -$11,442,688 | $3,548,116 | $75 | $59,702 |
| Hanford Joint Union High School District | 16,070 | -$4,065,421 | $1,199,348 | $75 | $51,765 |
| Ramona City Unified School District | 5,867 | -$1,276,813 | $439,341 | $75 | $76,273 |
| Aromas-San Juan Unified School District | 1,184 | -$256,774 | $90,268 | $76 | $58,413 |
| Modoc Joint Unified School District | 908 | -$198,829 | $69,152 | $76 | $37,090 |
| Central Unified School District | 15,468 | -$3,805,370 | $1,190,870 | $77 | $59,256 |
| Irvine Unified School District | 30,368 | -$7,707,177 | $2,324,018 | $77 | $89,571 |
| Lemoore Union High School District | 7,708 | -$1,803,857 | $592,512 | $77 | $50,818 |
| Victor Valley Union High School District | 39,551 | -$9,408,054 | $3,058,045 | $77 | $45,654 |
| Walnut Valley Unified School District | 15,936 | -$3,713,836 | $1,234,061 | $77 | $91,919 |
| Big Valley Joint Unified School District | 195 | -$35,235 | $15,175 | $78 | $47,404 |
| Kelseyville Unified School District | 1,715 | -$382,885 | $133,988 | $78 | $48,242 |
| La Honda-Pescadero Unified School District | 340 | -$88,451 | $26,570 | $78 | $94,464 |
| Roseville Joint Union High School District | 31,427 | -$7,342,496 | $2,458,955 | $78 | $77,405 |
| Temecula Valley Unified School District | 30,079 | -$6,947,624 | $2,345,260 | $78 | $81,963 |
| Castro Valley Unified School District | 10,774 | -$2,538,664 | $848,290 | $79 | $94,116 |
| Del Norte County Unified School District | 3,993 | -$783,033 | $313,531 | $79 | $37,909 |
| Orland Joint Unified School District | 2,156 | -$468,335 | $171,843 | $80 | $39,226 |
| Hamilton Unified School District | 764 | -$143,851 | $61,516 | $81 | NA |
| Westside Elementary School District | 758 | -$197,931 | $61,470 | $81 | $33,036 |
| Acalanes Union High School District | 17,517 | -$3,885,550 | $1,431,192 | $82 | $99,115 |
| Coronado Unified School District | 3,248 | -$735,313 | $265,233 | $82 | $91,103 |
| Oroville Union High School District | 10,375 | -$2,420,801 | $853,234 | $82 | $39,498 |
| Raisin City Elementary School District | 618 | -$169,033 | $50,639 | $82 | $33,636 |
| San Marcos Unified School District | 19,758 | -$4,474,907 | $1,625,822 | $82 | $56,332 |
| Corning Union High School District | 3,295 | -$654,603 | $272,884 | $83 | $41,762 |
| Fallbrook Union High School District | 10,642 | -$2,104,853 | $882,591 | $83 | $61,895 |
| Capistrano Unified School District | 82,193 | -$16,300,308 | $6,951,253 | $85 | $97,469 |
| Vista Unified School District | 26,341 | -$5,244,661 | $2,226,215 | $85 | $54,196 |
| Freshwater Elementary School District | 335 | -$68,801 | $28,730 | $86 | $47,407 |
| Lassen Union High School District | 3,402 | -$721,978 | $293,173 | $86 | $58,731 |
| Willows Unified School District | 2,396 | -$471,321 | $206,485 | $86 | $46,642 |
| Butte Valley Unified School District | 327 | -$64,169 | $28,586 | $87 | $29,811 |
| Perris Union High School District | 31,963 | -$6,536,512 | $2,767,381 | $87 | $51,611 |
| Snowline Joint Unified School District | 7,935 | -$1,401,933 | $692,722 | $87 | $57,152 |
| Lindsay Unified School District | 4,228 | -$778,189 | $376,528 | $89 | $34,025 |
| Nevada Joint Union High School District | 18,688 | -$3,668,860 | $1,660,600 | $89 | $55,753 |
| Central Union High School District | 13,940 | -$2,527,968 | $1,250,562 | $90 | $44,233 |
| Alpaugh Unified School District | 560 | -$107,147 | $50,805 | $91 | $27,443 |
| Davis Joint Unified School District | 8,792 | -$1,517,581 | $798,215 | $91 | $59,390 |
| Western Placer Unified School District | 9,464 | -$1,665,175 | $861,141 | $91 | $71,454 |
| San Dieguito Union High School District | 27,151 | -$4,385,369 | $2,511,143 | $92 | $106,006 |
| Sierra Unified School District | 1,411 | -$196,725 | $129,156 | $92 | $66,111 |
| Middletown Unified School District | 1,598 | -$213,073 | $148,230 | $93 | $57,937 |
| Poway Unified School District | 35,938 | -$6,112,730 | $3,341,934 | $93 | $102,190 |
| Rocklin Unified School District | 12,778 | -$2,304,952 | $1,194,469 | $93 | $78,067 |
| Northern Humboldt Union High School District | 5,514 | -$867,155 | $523,596 | $95 | $43,157 |
| Waterford Unified School District | 3,878 | -$550,834 | $371,250 | $96 | $52,792 |
| Center Joint Unified School District | 4,745 | -$678,892 | $461,158 | $97 | $55,584 |
| Fall River Joint Unified School District | 1,166 | -$181,068 | $113,228 | $97 | $39,271 |
| Holtville Unified School District | 2,175 | -$255,571 | $213,966 | $98 | $41,895 |
| Sutter Union High School District | 2,016 | -$277,524 | $197,671 | $98 | $62,073 |
| Travis Unified School District | 5,518 | -$841,947 | $538,221 | $98 | $87,443 |
| Turlock Unified School District in Chatom Union | 663 | -$88,744 | $66,034 | $100 | $42,672 |
| Denair Unified School District | 1,535 | -$143,174 | $157,073 | $102 | $72,544 |
| San Jacinto Unified School District | 9,980 | -$1,296,360 | $1,014,061 | $102 | $44,131 |
| Durham Unified School District | 988 | -$91,168 | $103,487 | $105 | $63,155 |
| La Ca?ada Unified School District | 4,204 | -$491,421 | $439,767 | $105 | $165,278 |
| San Ramon Valley Unified School District | 31,291 | -$3,774,745 | $3,295,750 | $105 | $134,615 |
| Summerville Union High School District | 1,746 | -$207,336 | $182,616 | $105 | $48,790 |
| Templeton Unified School District | 2,486 | -$275,864 | $266,604 | $107 | $71,330 |
| Wheatland Union High School District | 3,030 | -$279,398 | $323,532 | $107 | $63,936 |
| Mendocino Unified School District | 521 | -$57,108 | $56,020 | $108 | $39,620 |
| Santa Paula Unified (9-12) in Briggs | 938 | -$177,561 | $101,185 | $108 | $54,349 |
| Murrieta Valley Unified School District | 23,002 | -$1,836,501 | $2,569,417 | $112 | $74,486 |
| Valley Center-Pauma Unified School District | 4,202 | -$297,177 | $472,197 | $112 | $79,566 |
| Los Gatos-Saratoga Joint Union School District | 9,516 | -$636,386 | $1,096,877 | $115 | $143,458 |
| Palo Alto Unified School District | 13,051 | -$812,926 | $1,504,962 | $115 | $118,764 |
| Val Verde Unified School District | 19,797 | -$1,294,531 | $2,268,165 | $115 | $55,791 |
| Trinity Alps Unified School District in Trinity Center | 13 | $1,507 | $1,507 | $116 | $29,886 |
| Trinity Alps Unified School District in Cox Bar | 10 | $1,171 | $1,171 | $117 | $29,773 |
| Lammersville Joint Unified School District | 2,421 | -$201,087 | $291,780 | $121 | $101,232 |
| Lucerne Valley Unified School District | 2,793 | -$154,628 | $338,799 | $121 | $29,968 |
| Palos Verdes Peninsula Unified School District | 12,182 | -$368,664 | $1,478,162 | $121 | $129,282 |
| Imperial Unified School District | 3,831 | -$127,367 | $466,097 | $122 | $67,096 |
| Mountain Empire Unified School District | 2,931 | -$232,894 | $358,701 | $122 | $49,242 |
| San Miguel Joint Union Elementary School District | 742 | -$106,587 | $90,953 | $123 | $67,063 |
| Knights Ferry Elementary School District | 94 | $11,657 | $11,657 | $124 | $53,125 |
| Cutten Elementary School District | 559 | -$7,045 | $70,493 | $126 | $56,307 |
| Ferndale Unified School District | 510 | -$15,364 | $64,830 | $127 | $45,188 |
| Pope Valley Union Elementary School District | 53 | $6,808 | $6,808 | $128 | $65,208 |
| Warner Unified School District | 287 | $485 | $36,711 | $128 | $35,865 |
| Coachella Valley Unified School District | 19,013 | -$20,732 | $2,458,032 | $129 | $38,312 |
| South Bay Union Elementary School District | 861 | -$49,028 | $111,147 | $129 | $47,548 |
| Stony Creek Joint Unified School District | 100 | $4,046 | $13,068 | $131 | $35,417 |
| Tulelake Basin Joint Unified School District | 470 | $27,332 | $62,917 | $134 | $34,934 |
| Southern Trinity Joint Unified School District | 97 | $13,068 | $13,068 | $135 | $25,357 |
| Lammersville Joint Unified School District (9-12) | 33 | $4,618 | $4,618 | $140 | $59,688 |
| Hickman Elementary School District | 1,142 | $69,494 | $163,435 | $143 | $56,103 |
| Alexander Valley Union Elementary School District | 118 | $17,110 | $17,110 | $145 | $78,125 |
| Surprise Valley Joint Unified School District | 116 | $16,784 | $16,784 | $145 | $30,625 |
| Julian Union High School District | 3,347 | $106,711 | $502,284 | $150 | $61,250 |
| Oak Park Unified School District | 4,574 | $328,282 | $692,587 | $151 | $128,448 |
| Biggs Unified School District | 540 | $52,469 | $82,723 | $153 | $50,231 |
| Trinity Alps Unified School District in Junction City | 84 | $12,943 | $12,943 | $154 | $42,250 |
| Camptonville Elementary School District | 433 | $67,257 | $67,257 | $155 | $24,732 |
| East Nicolaus Joint Union High School District | 3,040 | $345,836 | $470,701 | $155 | $66,442 |
| Mattole Unified School District | 828 | $130,668 | $130,668 | $158 | $36,154 |
| Westwood Unified School District | 393 | $61,995 | $61,995 | $158 | $29,145 |
| Valley Home Joint Elementary School District | 165 | $26,317 | $26,317 | $159 | $62,188 |
| Princeton Joint Unified School District | 203 | $32,520 | $32,520 | $160 | $61,136 |
| Alvina Elementary School District | 204 | $32,836 | $32,836 | $161 | $46,250 |
| Manzanita Elementary School District | 303 | $48,688 | $48,688 | $161 | $50,278 |
| Pacific Unified School District | 77 | $12,415 | $12,415 | $161 | $38,750 |
| Piedmont City Unified School District | 2,766 | $393,399 | $444,948 | $161 | $207,222 |
| Plaza Elementary School District | 139 | $22,381 | $22,381 | $161 | $65,000 |
| Mission Union Elementary School District | 125 | $20,249 | $20,249 | $162 | $48,750 |
| West Side Union Elementary School District | 179 | $28,909 | $28,909 | $162 | $77,270 |
| Garfield Elementary School District | 62 | $10,120 | $10,120 | $163 | $66,389 |
| Lake Elementary School District | 160 | $26,115 | $26,115 | $163 | $60,625 |
| San Marino Unified School District | 3,220 | $528,184 | $528,184 | $164 | $131,702 |
| Shandon Joint Unified School District | 315 | $51,568 | $51,568 | $164 | $62,344 |
| Roberts Ferry Union Elementary School District | 104 | $17,283 | $17,283 | $166 | $53,125 |
| Gratton Elementary School District | 133 | $22,323 | $22,323 | $168 | $84,583 |
| Kneeland Elementary School District | 33 | $5,535 | $5,535 | $168 | $58,125 |
| Trinity Alps Unified School District in Burnt Ranch | 92 | $15,477 | $15,477 | $168 | $35,128 |
| Monroe Elementary School District | 205 | $35,457 | $35,457 | $173 | $35,500 |
| Owens Valley Unified School District | 1,703 | $220,354 | $294,059 | $173 | $53,281 |
| Pleasant Valley Joint Union Elementary School District | 127 | $22,265 | $22,265 | $175 | $85,000 |
| Howell Mountain Elementary School District | 105 | $18,520 | $18,520 | $176 | $61,842 |
| Potter Valley Community Unified School District | 278 | $49,062 | $49,062 | $176 | $54,509 |
| Yosemite Unified School District in Raymond-Knowles | 83 | $14,622 | $14,622 | $176 | $60,313 |
| Burrel Union Elementary School District | 121 | $21,593 | $21,593 | $178 | $35,417 |
| Pine Ridge Elementary School District | 94 | $17,493 | $17,493 | $186 | $64,167 |
| Trinity Alps Unified School District in Douglas City | 165 | $31,385 | $31,385 | $190 | $40,125 |
| Scott Valley Unified School District in Forks of Salmon | 11 | $2,256 | $2,256 | $205 | $20,938 |
| Trinity Alps Unified School District in Coffee Creek | 14 | $3,207 | $3,207 | $229 | $50,938 |
| Anderson Valley Unified School District | 562 | -$113,523 | $46,914 | $83 | $40,104 |