Resource Inequality
In this second installment of Power in Numbers, EdBuild discusses each state’s responsibility, and frequent failure, to provide their children with “an equal start in life and to an equal opportunity to reach their full potential as citizens”. [1].
Skip to:
The right to an education is found in every state Constitution, which means that every state is constitutionally obligated to provide schooling for all children, regardless of income. The United States Constitution, though, does not guarantee the right to education, as the Supreme Court confirmed in its 1973 case San Antonio v. Rodriguez. Since then, all legal challenges to education funding systems have been tried in state courts, producing rulings that are only binding in a single state. To date, twenty-eight state supreme courts have mandated overhauls to their states’ school finance systems, ruling them unconstitutional because of their inherent inequality or inadequacy.
Even though the responsibility to provide public education rests with the state, school funding has historically been left up to the local community. This means that resources for schools are, to varying degrees, tied to local wealth and invariably leave schools in low-income communities at a disadvantage. Generally, when state courts strike down state funding systems, the remedy is that the state must guarantee equal access to education by providing some form of supplemental funding to schools in poorer neighborhoods to compensate for unequal local resources. Our analysis of school district revenues (adjusted for differences in cost of living around the country) finds that, even after court-ordered equitable funding measures, the majority of states are still failing to fund students in high-poverty districts at a level equal to or higher than their less needy peers.
Falling Short
The inequity in many states is dramatic. For the nation as a whole, when we compare the education dollars available in highest- and lowest-poverty districts within each state, we find that, on average, high-poverty school districts in each state receive 5%, or $500 less per student than wealthy ones do[2]. Some states are much, much worse. Texas and Louisiana are the most regressive—the most affluent school districts in these states receive 19% more funding for their students than the highest-poverty districts do. Illinois and Montana aren’t much better; their high-poverty school districts receive almost 18% less funding per pupil than their better-off in-state peers. In the map below you’ll note that in 26 states, high-poverty students receive less funding for their education than their more affluent peers. In only six states do students in high-poverty districts receive at least 10% more funding than those in low-poverty districts, despite significantly higher need. Explore the map below to get a closer look at the regressive nature of school funding in all fifty states[3].
Cost-Adjusted Revenues, A Deeper Look at Regressiveness
| State | Percent Difference | Revenue Per-Pupil All Districts |
Revenue Per-Pupil High-Poverty Districts |
Revenue Per-Pupil Low-Poverty Districts |
|---|---|---|---|---|
| Alabama | -13% | $8,931 | $8,524 | $9,851 |
| Alaska | 4% | $17,066 | $16,348 | $15,738 |
| Arizona | -2% | $10,395 | $7,706 | $7,857 |
| Arkansas | 5% | $9,851 | $10,147 | $9,701 |
| California | -16% | $7,795 | $7,134 | $8,537 |
| Colorado | -5% | $10,671 | $10,337 | $10,941 |
| Connecticut | 0% | $14,380 | $13,989 | $13,937 |
| Delaware | 6% | $12,665 | $13,060 | $12,270 |
| Florida | 3% | $7,998 | $7,925 | $7,684 |
| Georgia | 7% | $9,148 | $9,554 | $8,895 |
| Idaho | 10% | $7,890 | $8,887 | $8,065 |
| Illinois | -18% | $11,893 | $10,717 | $13,139 |
| Indiana | 6% | $11,192 | $11,533 | $10,937 |
| Iowa | 2% | $11,270 | $11,367 | $11,157 |
| Kansas | 6% | $11,554 | $11,571 | $10,935 |
| Kentucky | -1% | $9,253 | $9,297 | $9,441 |
| Louisiana | -19% | $11,327 | $10,943 | $13,490 |
| Maine | -8% | $11,403 | $11,106 | $12,057 |
| Maryland | -4% | $12,607 | $12,306 | $12,878 |
| Massachusetts | 8% | $12,439 | $13,223 | $12,196 |
| Michigan | -4% | $10,502 | $10,330 | $10,729 |
| Minnesota | 11% | $12,683 | $12,391 | $11,210 |
| Mississippi | 5% | $8,314 | $8,332 | $7,960 |
| Missouri | -11% | $9,963 | $9,384 | $10,579 |
| Montana | -18% | $11,527 | $10,219 | $12,422 |
| Nebraska | 9% | $14,330 | $15,192 | $14,007 |
| Nevada | -5% | $11,044 | $12,219 | $12,880 |
| New Hampshire | 13% | $13,364 | $14,215 | $12,614 |
| New Jersey | 9% | $16,773 | $17,774 | $16,346 |
| New Mexico | -5% | $11,390 | $10,928 | $11,543 |
| New York | -10% | $20,123 | $19,752 | $21,908 |
| North Carolina | 11% | $8,130 | $8,612 | $7,750 |
| North Dakota | 0% | $14,061 | $13,988 | $13,997 |
| Ohio | -3% | $11,716 | $11,811 | $12,182 |
| Oklahoma | -12% | $8,652 | $8,186 | $9,286 |
| Oregon | 3% | $9,073 | $9,352 | $9,078 |
| Pennsylvania | -6% | $13,147 | $12,833 | $13,644 |
| Rhode Island | -10% | $12,647 | $11,256 | $12,475 |
| South Carolina | -2% | $9,895 | $9,937 | $10,143 |
| South Dakota | -4% | $9,523 | $9,105 | $9,536 |
| Tennessee | 3% | $8,193 | $8,307 | $8,068 |
| Texas | -19% | $12,382 | $11,270 | $13,965 |
| Utah | 3% | $8,691 | $8,620 | $8,413 |
| Vermont | -2% | $13,528 | $13,203 | $13,472 |
| Virginia | -4% | $10,137 | $9,782 | $10,161 |
| Washington | 10% | $11,283 | $11,791 | $10,678 |
| West Virginia | -5% | $11,057 | $10,865 | $11,443 |
| Wisconsin | 16% | $12,633 | $13,741 | $11,805 |
| Wyoming | -16% | $17,885 | $17,375 | $20,695 |
This state-level view of school funding inequity is important since, as noted above, state policy is the only recourse for disadvantaged students. But this state-by-state examination of the issue hides a great deal of the injustice. Because of the inequitable distribution of wealth across the country, the regressiveness of the average state’s funding formula pales in comparison to the inequities of education finance in the nation at large. When we simply compare the education revenue available for students in the highest- and lowest-poverty districts in the country, irrespective of state lines, we find that the nation as a whole is worse than any single state: the poorest districts in America receive 21% less funding than the wealthiest ones do.
Local Control
State school funding formulas, in theory, aim to ensure that each school district within the state, no matter its local resources, has the necessary funds to operate and maintain its school system. This is a significant challenge first and foremost because of our long and continued history of local control. Education funding in most states is reliant on a significant contribution from local funding, largely property taxes. Because property taxes are tied to the value of a home, a school district’s tax base is dependent on the wealth of their neighborhood. Poor communities must tax themselves at a much higher rate to collect the same revenue as a wealthier community. Take, for example, Ferguson-Florissant and Ladue City school districts just outside St. Louis, Missouri. In 2013, Ladue City taxed its property at 3.6% for a cost-adjusted local contribution of $11,249 per student. Meanwhile, just to the north in Ferguson-Florissant, where the student poverty rate is over five times that of Ladue City, its 5.5% property tax contributes to a $4,445 per student local share. Despite the fact that Ferguson-Florissant's property tax rate is more than 150% of Ladue City's, the lower valuation of its property tax base means the district only generates 40% as much in local revenue.
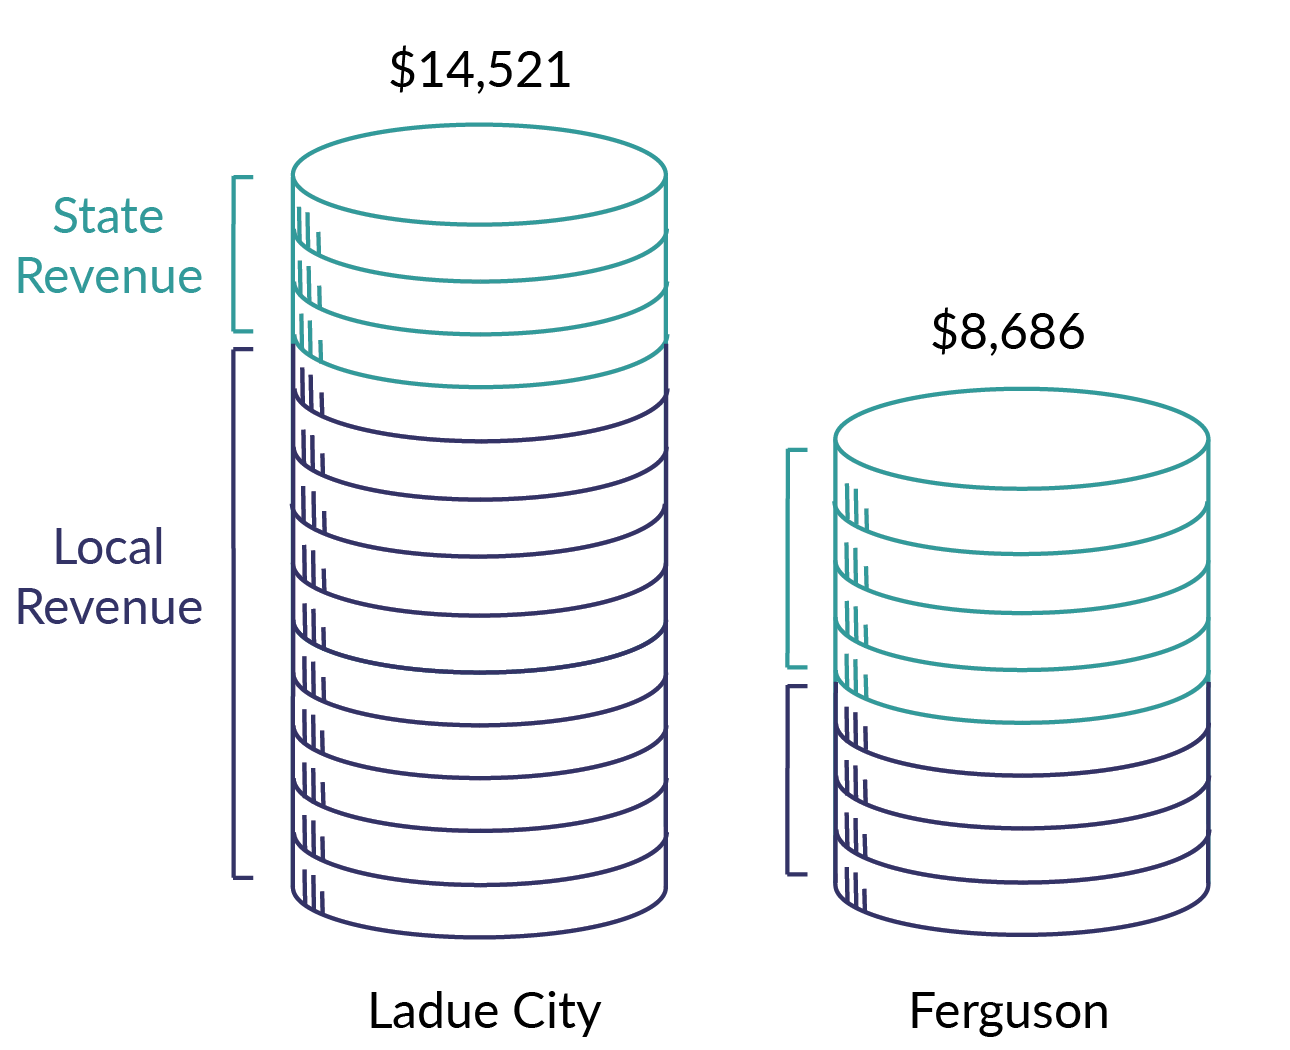
In cases like this, the state contribution should seek to make up the difference in property wealth by directing more state aid to school districts where property values are lower. In practice, though, the majority of states are not providing enough state aid to make up the difference. The level of state aid is higher in Ferguson-Florissant than in Ladue City (almost $1,000 higher, per pupil in fact), but it’s still not enough to make up the difference between what the two cities can raise locally. After state and local contributions, Ferguson-Florissant received almost $6,000 less per-pupil than Ladue City. In Missouri, as in many other states in the country, the state fails to ensure that a district like Ferguson-Florissant can keep up with the financial resources of their wealthier neighbors.
On average, across all states in the country, the highest-poverty school districts generate (on a cost-adjusted basis) just $4,787 per student from local taxes, while the most affluent districts raise $7,380—a difference of $2,593. State governments do provide an average of $2,042 more to the highest-poverty districts in an effort to make up the difference in local funds. But that still leaves those low-income districts $551 short, on average, while facing higher costs associated with educating needier students. On the whole, our current funding system requires the highest-poverty districts to tax themselves at a higher rate, while they receive, on average, 5%, or $500 less per student less than their wealthier peers.
Nowhere to Turn
Just a year after San Antonio, in 1974, the United States Supreme Court’s ruling in Milliken v. Bradley cut off yet another avenue of recourse for underfunded districts. The case dealt with racial segregation: the court heard arguments on whether the largely white suburban school districts surrounding mostly-black Detroit could be included in a court-ordered desegregation plan. There was no question as to whether Detroit City Schools were segregated—they were then, and they are now. The question was whether the surrounding suburban school districts could be compelled to be part of the fix, since only by integrating students across district lines could Detroit-area schools achieve a meaningful level of diversity. Overturning the District Court’s redistricting plan, the Supreme Court ruled that desegregation could not be enforced across district borders. The ruling stated that desegregation efforts do not require "any particular racial balance,” and that regardless, neighboring districts were not required to participate in the desegregation of inner-city school systems. Even though the Court agreed that Detroit was segregated, and that the government’s own policies were the cause of the segregation, the ruling in Milliken v. Bradley meant the city could not ask its neighbors to contribute to a solution. Detroit Public Schools was on its own.
This is not just about Detroit Public schools. If district borders are to be respected, no matter how starkly they divide students from opportunity—even in the face of a clear constitutional injustice—then all low-income communities are truly on their own. These borders trap kids inside school districts that aren’t able to provide for them, and leave them with little or no recourse.
With other political units, we recognize that boundaries must be amended periodically to keep up with changes in population and to maintain a fair and just society. Our congressional district boundaries, for instance, are redrawn after every decennial census. There are federal laws to prohibit the gerrymandering of congressional districts and the drawing of boundaries that “dilute the strength of minority voters”. There are laws that give any citizen the right to challenge the constitutionality of congressional district boundaries in federal court. School district boundaries, on the other hand, have no requirement to be redrawn as the population changes. There is no requirement that school district boundaries, new or old, be evaluated for their impacts on students and communities. As a result, we as a society are required to diagnose or reconcile the consequences of our divisive and inequitable school district borders.
Where We Stand
The Milliken v. Bradley and San Antonio v. Rodriguez rulings continue to impact our education funding systems and limit the ways that beleaguered school districts can seek justice. Since San Antonio v. Rodriguez, school districts have been unable to look to the federal courts when their states do not provide appropriate funds to level the playing field. And because of Milliken v. Bradley, schools and communities cannot look across school district boundaries for resources.
You can explore some of the impacts of these two decisions in the map below, which shows the difference between each school district’s revenue and the average revenue for its state. Red districts receive less revenue than the state average while blue districts receive more than the state average. Hover over a district to get more information about the district’s revenue sources and demographics. For more context, you can click VIEW POVERTY DATA to view the map colored by student poverty rates and toggle back and forth between the two layers.
We start in Missouri with Ferguson-Florissant and Ladue City school districts highlighted in black. As you can see, despite the fact that Ferguson-Florissant receives a higher percentage of state aid than Ladue City does, it still has 13% less revenue per pupil than the state average, while Ladue City receives 46% more. Use the dropdown menu to select other states to view their disparities in revenue.
Under our current system, wealthy communities and municipalities alike are incentivized to maintain the walls between themselves and their worse-off neighbors, andMilliken v. Bradley upholds their right to do so. Additionally, San Antonio v. Rodriguez absolves the federal government of any responsibility for ensuring access to education, leaving low-income school districts isolated and with very limited means of demanding the same funding and opportunities afforded to wealthier districts. The result is that needy kids are trapped in school districts that aren’t required, or able, to spend as much for their educations as other districts do for their peers. The Supreme Court has said for more than 40 years that the responsibility to change these inequities in education funding sits squarely with the states. All but a handful of states are failing to fulfill this duty. As Justice Thurgood Marshall argued in his passionate dissent in Milliken v. Bradley, all children have “the right… to an equal opportunity to reach their full potential as citizens.” The same children to whom that right has been denied in the past “deserve better than to see fences thrown up to deny them that right in the future.”